May 16, 2023 - Statistical Significance

Civalgo Mobile App
Today, a significant portion of my day was dedicated to mobile app development. My motivation to drive this project stems from its potential to be a cornerstone in a new sales approach, opening doors to a new market base and serving as a proof of concept for a transformative way of evolving our technology. Instead of one large, monolithic software, we are exploring the development of Civalgo's technology as a series of independent, standalone products. I envision this project having a significant impact on our sales, marketing, and the way we create technology in our business. That's why I am fully dedicated to making it successful.
Mobile App Time Entries
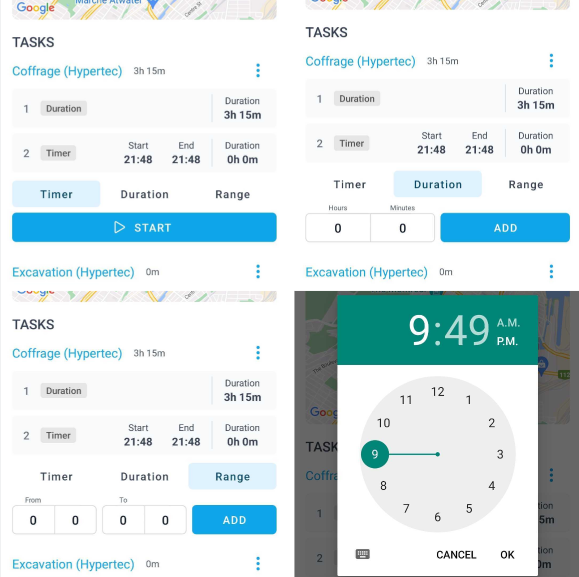
In the application, I've coded three methods for employees to log their time on their daily tasks: a Timer that can be started and stopped (which also tracks your GPS location when you toggle the timer as per some clients' request), a Duration entry where you simply input the hours and minutes spent on a task and a Range option where you provide the start and end time of your work on a task.
The rationale behind providing multiple data entry methods is that we serve diverse companies, and I don't think it's our role to dictate our clients' operational processes. Instead, we should offer them the freedom to choose how our software best fits their unique needs. However, it's worth noting that some clients prefer a specific way of compiling their reports and seek uniformity across their workforce. That's why we will allow companies to select their preferred data entry method in the settings, ensuring that all their employees follow the same method.
In essence, my philosophy is to provide our clients with the flexibility to use our software as they see fit, while also giving them the option to self-impose constraints as per their preference.
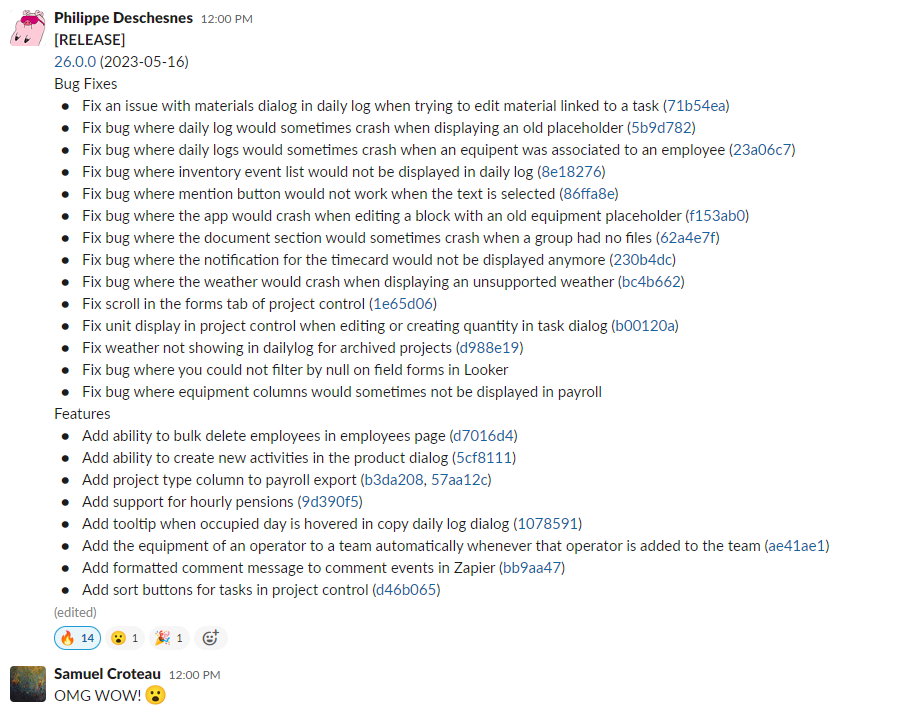
Civalgo App Release
Midway through the day, I supported the team in rolling out the initial release of iteration 26 into production, and I must admit I was blown away by the sheer volume of changes made. As someone who continually evaluates whether our company is progressing at a fast enough pace, witnessing such results is truly uplifting. I'm extremely proud of the team for this achievement.
User Analytics
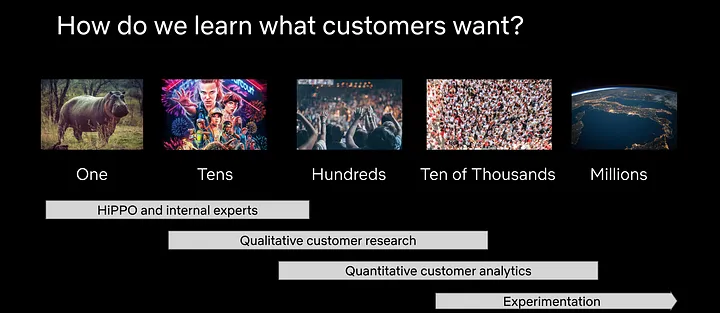
I was tasked with compiling a user analytics report, in which I utilized Mixpanel to derive insights about our users and draw meaningful conclusions. Making data-driven decisions is crucial to informed decision-making and adopting a user-centric approach. But how does one acquire this data? Some might automatically turn to trackers or A/B testing with tools like Mixpanel, Google Analytics, or others used by major companies like Google, Facebook, and Netflix. However, I argue that there's often a rush to these methods without proper consideration of the statistical significance of the data. In my view, you need tens of thousands of user events to conduct a conclusive A/B test. For a B2B startup like ours, we should be exploring alternative methods instead of falling back on these buzzword techniques to understand our users' needs.
Here are some steps, based on user volume, to collect statistically significant customer data:
- Self-Experience: This involves using the product internally to gain first-hand insights. It's a cost-effective starting point, but it's also the least statistically significant method due to the lack of user diversity. The number of users needed is essentially the number of team members using the product, which is usually small.
- User Interviews: Involves direct conversations with users to understand their experience and feedback. Depending on the diversity of your user base and the range of user experiences you want to capture, you may need to conduct interviews with dozens to hundreds of users to begin approaching statistical significance.
- Surveys: Surveys allow for broader feedback from a larger user base. To achieve a reasonable level of confidence, you'd typically want responses from at least 400 users. However, for more accurate results, especially if your user base is diverse, you may need responses from several thousand users.
- Observational Data: This involves analyzing actual user behavior and usage patterns. Given the larger sample sizes usually involved, this method can provide statistically significant insights. To detect smaller effects, you would need a larger sample size. This typically involves hundreds to thousands of users, depending on the specific analysis being conducted.
- Experimentation (e.g., A/B testing): Lastly, companies can run experiments with a user subgroup to establish cause-and-effect relationships between user behavior and specific product features or changes. This requires a large user base to ensure results are statistically significant. The number of users needed can vary greatly based on the expected effect size and desired power of the test. For small effect sizes, you might need tens of thousands of users or more. For larger effect sizes, a few thousand users might suffice.